Gatus: Automated Health Dashboard

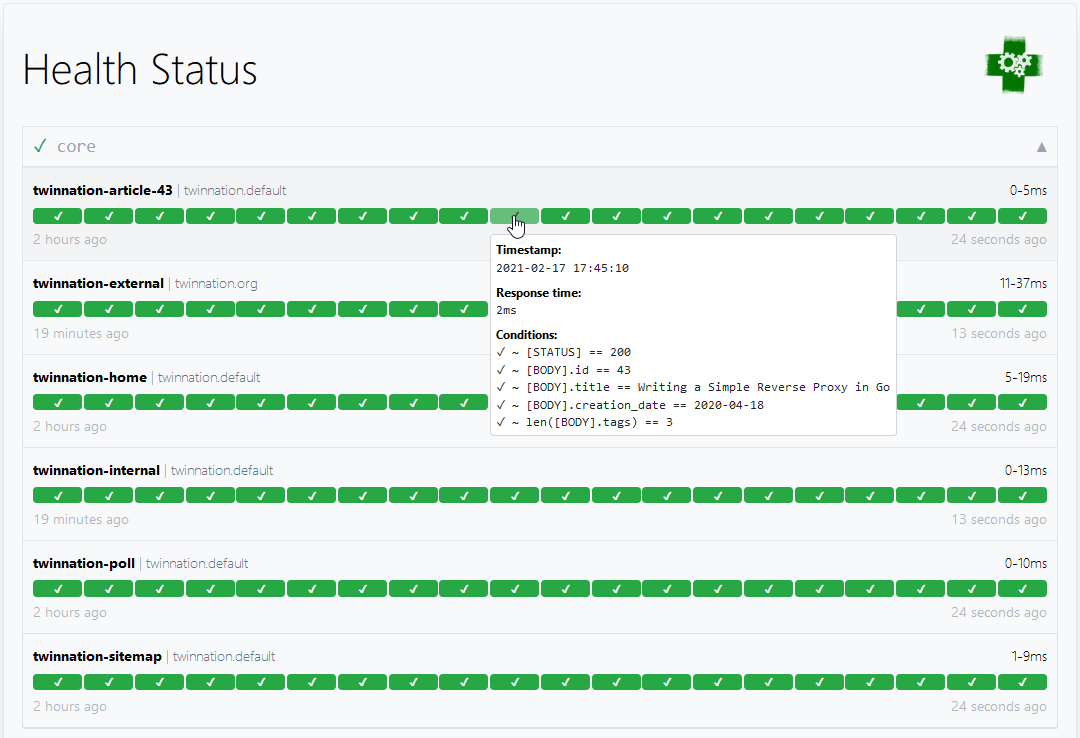
Live example: status.twin.sh
Gatus is a project that I started because I wanted to have a reliable automated health dashboard that was as low maintenance as possible.
Gatus is a developer-oriented health dashboard that gives you the ability to monitor your services using HTTP, ICMP, TCP, and even DNS queries as well as evaluate the result of said queries by using a list of conditions on values like the status code, the response time, the certificate expiration, the body and many others. The icing on top is that each of these health checks can be paired with alerting via Slack, PagerDuty, Discord, Twilio and more.
Originally, determining whether a service was healthy or not was going to be very simple: is the status 5xx? If yes, the service is unhealthy. After implementing that, however, I felt that it was far too lacking, because while it could help determine availability, it couldn’t really make the difference between “everything is ok” and “everything is not ok”.
While having 2xx responses is definitely a good start, what about the content of an endpoint? What if, for some unknown reason, your service is up, but it’s distributing no content at all? This wasn’t a question that Gatus could answer, so I decided to implement conditions, which would be used as a basis to determine whether a service was healthy or not.
Here’s a few examples:
| Condition | Description | Passing values | Failing values |
|---|---|---|---|
[STATUS] == 200 |
Status must be equal to 200 | 200 | 201, 404, … |
[STATUS] < 300 |
Status must lower than 300 | 200, 201, 299 | 301, 302, … |
[STATUS] <= 299 |
Status must be less than or equal to 299 | 200, 201, 299 | 301, 302, … |
[STATUS] > 400 |
Status must be greater than 400 | 401, 402, 403, 404 | 400, 200, … |
[STATUS] == any(200, 429) |
Status must be either 200 or 429 | 200, 429 | 201, 400, … |
[CONNECTED] == true |
Connection to host must’ve been successful | true | false |
[RESPONSE_TIME] < 500 |
Response time must be below 500ms | 100ms, 200ms, 300ms | 500ms, 501ms |
[IP] == 127.0.0.1 |
Target IP must be 127.0.0.1 | 127.0.0.1 | 0.0.0.0 |
[BODY] == 1 |
The body must be equal to 1 | 1 | {}, 2, … |
[BODY].user.name == john |
JSONPath value of $.user.name is equal to john |
{"user":{"name":"john"}} |
|
[BODY].data[0].id == 1 |
JSONPath value of $.data[0].id is equal to 1 |
{"data":[{"id":1}]} |
|
[BODY].age == [BODY].id |
JSONPath value of $.age is equal JSONPath $.id |
{"age":1,"id":1} |
|
len([BODY].data) < 5 |
Array at JSONPath $.data has less than 5 elements |
{"data":[{"id":1}]} |
|
len([BODY].name) == 8 |
String at JSONPath $.name has a length of 8 |
{"name":"john.doe"} |
{"name":"bob"} |
has([BODY].errors) == false |
JSONPath $.errors does not exist |
{"name":"john.doe"} |
{"errors":[]} |
has([BODY].users) == true |
JSONPath $.users exists |
{"users":[]} |
{} |
[BODY].name == pat(john*) |
String at JSONPath $.name matches pattern john* |
{"name":"john.doe"} |
{"name":"bob"} |
[BODY].id == any(1, 2) |
Value at JSONPath $.id is equal to 1 or 2 |
1, 2 | 3, 4, 5 |
[CERTIFICATE_EXPIRATION] > 48h |
Certificate expiration is more than 48h away | 49h, 50h, 123h | 1h, 24h, … |
[DOMAIN_EXPIRATION] > 720h |
The domain must expire in more than 720h | 4000h | 1h, 24h, … |
To give you a better idea of what the configuration file looks like, here’s a sample:
endpoints:
  - name: website                 # Name of your endpoint, can be anything
    url: "https://twin.sh/health"
    interval: 5m                  # Duration to wait between every status check (default: 60s)
    conditions:
      - "[STATUS] == 200"         # Status must be 200
      - "[BODY].status == UP"     # The json path "$.status" must be equal to UP
      - "[RESPONSE_TIME] < 300"   # Response time must be under 300ms
The configuration above checks the health of the service website by sending a request to
https://twin.sh/health every 30 seconds, and validates whether the status is 200, the
body has the field status with the value UP, and the response time is less than 300ms.
To help you better visualize what [BODY].status == UP means, here’s what the body of https://twin.sh/health
looks like:
{
  "status": "UP"
}
As I mentioned, this is a simple example. You could have significantly more specific conditions:
endpoints:
  - name: some-endpoint-that-does-not-exist
    url: https://example.org/api/v1/posts/1234
    interval: 5m
    conditions:
      - "[STATUS] == 200"
      - "[BODY].id == 1234"
      - "len([BODY].title) > 0"
      - "len([BODY].author) > 0"
      - "len([BODY].tags) >= 3"
The above would expect a status of 200, as well as a body with a title and an author that’s with at least 1 character long as well as a list of at least 3 tags, e.g.:
{
  "id": 1234,
  "title": "Gardening tips or something like that",
  "author": "johndoe",
  "tags": [
    "gardening",
    "grass",
    "nature",
    "tips"
  ]
}
You could add more specific conditions, such as "[BODY].tags[0] == gardening" and "[BODY].author == johndoe",
if you know that the name of the first tag is gardening and you know that the author’s name is johndoe respectively.
If the tag was an object with a name field instead of just a string, your condition would be "[BODY].tags[0].name == gardening"
and the expected body would look something like:
{
  "id": 1234,
  "title": "Gardening tips or something like that",
  "author": "johndoe",
  "tags": [
    {
      "name": "gardening"
    },
    {
      "name": "grass"
    },
    {
      "name": "nature"
    },
    {
      "name": "tips"
    }
  ]
}
Regardless, Gatus can be used for both use cases:
- You know exactly what response to expect (e.g. you know the author’s name is johndoe)
- You have an idea what the response looks like, but you don’t know exactly what the data itself is
(e.g. you know that there should be at least 3 tags, because the minimum number of tags allowed is 3)
Among other things, Gatus also supports GraphQL requests:
endpoints:
  - name: filter-users-by-gender
    url: https://example.com/playground
    method: POST
    graphql: true
    body: |
      {
        users(gender: "female") {
          id
          name
          gender
          avatar
        }
      }
    headers:
      Content-Type: application/json
    conditions:
      - "[STATUS] == 200"
      - "len([BODY].data.users) > 0"
      - "[BODY].data.users[0].gender == female"
      - "[BODY].data.users[0].id > 0"
      - "len([BODY].data.users[0].name) > 0"
For further documentation, please view the GitHub repository at github.com/TwiN/gatus
Finally, some of you may be asking yourselves the following:
Why would I use Gatus when I can just use Prometheus’ Alertmanager or Cloudwatch?
Neither of these can tell you that there’s a problem if there are no clients actively calling the endpoint. In other words, it’s because monitoring metrics mostly rely on existing traffic, which effectively means that unless your clients are already experiencing an issue, you won’t be notified.
Gatus, on the other hand, allows you to configure health checks for each of your features, which in turn allows it to monitor these features and potentially alert you before any clients are impacted.
A sign you may want to look into Gatus is by simply asking yourself whether you’d receive an alert if your load balancer was to go down right now. Will any of your existing alerts by triggered? Your metrics won’t report an increase in errors if there’s no traffic that makes it to your applications. This puts you in a situation where your clients are the ones that will notify you about the degradation of your services rather than you reassuring them that you’re working on fixing the issue before they even know about it.
To close this off, I’d love to say that Gatus is a fancy acronym, but in fact, it’s just a play on the word status.
I’ve also built a managed solution for Gatus out of Gatus, if that’s something you’re interested in.