Migrating Personal Projects To Kubernetes and Rewriting Website in Go
I’ve finally decided to migrate my personal projects to Kubernetes. This is something I have been wanting to tackle for a few months now, but due to cost and time constraints, I’ve been pushing it back, kind of.
I’ve been working with Kubernetes for almost two years in a professional setting, so it’s not as if it’s going to be a significant project, or so I thought.
Here’s what this project entails: - Picking a cloud provider for Kubernetes - Automating the deployment of the infrastructure using Terraform - Migrating the backend of this website to Go - Updating existing applications to be Kubernetes-friendly - Tips for using Kubernetes on a tight budget
Picking a cloud provider for Kubernetes
Personal projects are funded by my personal budget, which is nowhere near as high as a tech company’s budget.
My requirements are a managed control plane as well as 2 workers with at least 3G memory and 1 vCPU
As of 2020-03-14, this is what the cloud providers I took into consideration had to offer:
| Cloud provider | Service | Monthly cost (plane) | Worker type | Worker specs | Monthly cost (worker) | Monthly total |
|---|---|---|---|---|---|---|
| AWS | EKS | 72$ | t3.medium | 2vCPU, 4G | 2 x \(30 = \)60 | $132 |
| Google Cloud | GKE | 72$ (As of June 2020) | n1-standard-1 | 1vCPU, 4G | 2 x \(34 = \)68 | $140 |
| Azure | AKS | Free | B2S | 2vCPU, 4G | 2 x \(30 = \)60 | $60 |
| DigitalOcean | DOKS | Free | s-1vcpu-3gb | 1vCPU, 3G | 2 x \(15 = \)30 | $30 |
Although DigitalOcean conveniently has an instance fitting my memory requirement (3G) whereas the others have slightly more memory (4G), thus driving the price of the worker nodes up, even the 2vCPU, 4G instance is $20 per month, a whopping 33% less expensive than EKS and AKS.
In any case, both AWS and Google Cloud are disqualified based on the cost of the control plane alone.
This leaves DOKS and AKS. I’ve had a good experience with DigitalOcean before and the cost is half than of Azure’s, so the winner’s DO.
There are other costs besides this, such as a load balancer and disks for PV, but I’ll disregard that.
Automating the deployment of the infrastructure using Terraform
Sure, a bash script can get you a long way into automating the installation of a single cluster, but when you’re deploying an entire infrastructure made up of load balancers, databases, a Kubernetes cluster, an ingress controller, dozens of applications and even TLS certificates, Terraform is going to be a better choice.
Creating a Kubernetes cluster on DO is pretty straightforward:
resource "digitalocean_kubernetes_cluster" "k8s-cluster" {
  name    = var.cluster_name
  version = var.cluster_version
  region  = var.cluster_region
  tags    = [digitalocean_tag.cluster.name]

  node_pool {
    name       = "default"
    size       = "s-1vcpu-3gb"
    node_count = 2
    tags       = [digitalocean_tag.cluster.name]
  }
}
The creation of the load balancer, firewall and domain records is also simple:
resource "digitalocean_loadbalancer" "k8s-load-balancer" {
  name                   = format("%s-lb", var.cluster_name)
  region                 = var.cluster_region
  redirect_http_to_https = true
  enable_proxy_protocol  = true

  forwarding_rule {
    entry_protocol  = "http"
    entry_port      = 80
    target_protocol = "http"
    target_port     = 31080
  }

  // Let DigitalOcean's LB handle TLS termination
  forwarding_rule {
    entry_protocol  = "http2"
    entry_port      = 443
    target_protocol = "http"
    target_port     = 31080
    certificate_id  = digitalocean_certificate.certificate.id
  }

  forwarding_rule {
    entry_protocol  = "http"
    entry_port      = 31260
    target_protocol = "http"
    target_port     = 31260
  }

  // https://github.com/containous/traefik/issues/5488
  healthcheck {
    port                = 31260
    protocol            = "tcp"
    healthy_threshold   = 2
    unhealthy_threshold = 2
  }

  droplet_tag = digitalocean_tag.cluster.name
}

resource "digitalocean_firewall" "public" {
  name = replace(format("%s-fw", var.cluster_name), ".", "-")
  tags = [digitalocean_tag.cluster.name]

  inbound_rule {
    protocol                  = "tcp"
    port_range                = "31260"
    source_load_balancer_uids = [digitalocean_loadbalancer.k8s-load-balancer.id]
  }

  inbound_rule {
    protocol                  = "tcp"
    port_range                = "31080"
    source_load_balancer_uids = [digitalocean_loadbalancer.k8s-load-balancer.id]
  }

  outbound_rule {
    protocol   = "tcp"
    port_range = "1-65535"
  }
}

resource "digitalocean_record" "domain" {
  domain = data.digitalocean_domain.primary.name
  type   = "A"
  name   = "@"
  value  = digitalocean_loadbalancer.k8s-load-balancer.ip
  ttl    = 120
}

resource "digitalocean_record" "wildcard-domain" {
  domain = data.digitalocean_domain.primary.name
  type   = "A"
  name   = "*"
  value  = digitalocean_loadbalancer.k8s-load-balancer.ip
  ttl    = 120
}
DigitalOcean also supports automatic creation and renewal of certificate with Lets Encrypt, and since the cluster doesn’t have a lot of CPU, I decided to terminate TLS on the load balancer rather than letting the ingress controller do it.
Migrating the backend of this website to Go
This website has gone through a few migrations.
Under a different domain, I originally created the website in PHP (I was young and I didn’t know better).
As I started getting more serious about programming, I rewrote it in Java in 2017 using Spring Boot, and then converted it to Kotlin in 2019. The application itself has uses that extend outside of this website, but I have slowly started splitting it into microservices.
What I want to say is, the JVM is cute - but it just uses too much resources.
So I finally made up my mind to rewrite it from scratch, in Go.
Updating existing applications to be Kubernetes-friendly
No more using binaries; it’s time to dockerize the applications that weren’t already dockerized.
Truth be told, for most of my applications use a Dockerfile that looks like this:
# Build the go application into a binary
FROM golang:alpine as builder
WORKDIR /app
ADD . ./
RUN CGO_ENABLED=0 GOOS=linux go build -mod vendor -a -installsuffix cgo -o bin/twinnation .
RUN apk --update add ca-certificates

# Run the binary on an empty container
FROM scratch
ENV APP_HOME=/app
ENV APP_DATA=${APP_HOME}/data
ENV PORT=8080
ENV DOMAIN="twin.sh"
ENV ENVIRONMENT="prod"
WORKDIR ${APP_HOME}
COPY --from=builder /app/bin/twinnation ./bin/twinnation
COPY --from=builder /app/static ./static
COPY --from=builder /app/data ./data
COPY --from=builder /etc/ssl/certs/ca-certificates.crt /etc/ssl/certs/ca-certificates.crt
EXPOSE ${PORT}
VOLUME ${APP_DATA}
ENTRYPOINT ["/app/bin/twinnation"]
By using multi-stage build, the images do take longer to build, but the resulting Docker image is much smaller, which give us the opportunity of using GitHub Package Registry. Don’t misunderstand - I love open source and I open source as much projects as I can, but I’m not going to open source personal websites. Why am I bringing this up? Because Docker Hub only allows you to have one private Docker image, so I turn to GitHub Package Registry for personal projects since I have a GitHub Pro account, granting me 5G per month of data transfer out for packages and 3000 minutes of GitHub actions for private repositories.
The first GitHub action workflow I use is for running tests:
name: build
on:
  pull_request:
    paths-ignore:
      - '*.md'
  push:
    branches:
      - master
    paths-ignore:
      - '*.md'
jobs:
  build:
    name: Build
    runs-on: ubuntu-latest
    timeout-minutes: 5
    steps:
      - name: Set up Go
        uses: actions/setup-go@v2
        with:
          go-version: 1.16
      - name: Check out code into the Go module directory
        uses: actions/checkout@v2
      - name: Build binary to make sure it works
        run: go build -mod vendor
      - name: Test
        run: go test -mod vendor ./... -cover
It automatically runs on every PRs and pushes on the main branches every time a change that doesn’t involve only files ending with *.md. I only have 3000 minutes
after all, I can’t be wasting it on running tests every time I update the documentation.
The second workflow is for building the Docker image and publishing it to GitHub Package Registry:
name: publish
on:
 release:
  types: [published]
jobs:
 publish:
  name: Publish Docker image to GitHub Package Registry
  runs-on: ubuntu-latest
  timeout-minutes: 5
  steps:
   - name: Set up Go
     uses: actions/setup-go@v2
     with:
      go-version: 1.16
   - name: Check out code into the Go module directory
     uses: actions/checkout@v2
   - name: Build binary to make sure it works
     run: go build -mod vendor
   - name: Test
     run: go test -mod vendor -cover ./...
   - name: Build Docker image
     run: docker build . --file Dockerfile --tag docker.pkg.github.com/twinproduction/website/website:latest
   - name: Publish to GitHub Package Registry
     run: |
      docker login docker.pkg.github.com --username $GITHUB_ACTOR --password-stdin <<< '${{ secrets.GITHUB_TOKEN }}'
      docker push docker.pkg.github.com/twinproduction/website/website:latest
This one is triggered every time a release is published. It also runs the tests again first, just in case I neglect to look at the build/test job first.
Tips for using Kubernetes on a tight budget
Most of the projects deployed on my cluster are personal, non-profit projects, so the cost of running the cluster comes directly from my pockets. I’m sure this is also the case for many of you, so here’s a few tips that will help you reduce that cost a bit.
Look at the default resource configuration of your cluster
Most cloud providers will not spin up an empty cluster: they’ll spin up a cluster with some essential deployments already included.
For DigitalOcean, one of these is CoreDNS: an empty cluster comes with 2 replicas with a CPU request of 100m.
While in a larger cluster, it’s understandable to have a CPU request of 100m for your CoreDNS pods, if you’re running a cluster on a small budget with nodes that barely have any CPU at all, this high CPU request might prevent pods from being scheduled due to the node’s real estate in the CPU department. For a node with 2vCPU, these two pods alone account for 10% of your total available CPU.
After running several stress tests and seeing that CoreDNS barely requires any CPU, even under load, I determined that these resources might be better used by another pod.
I reduced the default CPU request (100m) for each pod by half with Terraform by using the following:
///////////////////////////////////////////////////////////////////////////////////////
// CoreDNS is automatically created when the cluster is created, however, the        //
// CPU request allocated is far too high for a cluster that has limited resources.   //
// Therefore, this file's purpose is to adjust the default configuration of CoreDNS  //
///////////////////////////////////////////////////////////////////////////////////////

resource "null_resource" "kubectl-apply" {
  triggers = {
    name = var.cluster_name
  }

  provisioner "local-exec" {
    when    = create
    command = "kubectl patch deploy coredns --patch \"{\\\"spec\\\":{\\\"template\\\": {\\\"spec\\\": {\\\"containers\\\":[{\\\"name\\\": \\\"coredns\\\",\\\"resources\\\":{\\\"requests\\\":{\\\"cpu\\\":\\\"50m\\\"}}}]}}}}}\" -n kube-system"
  }
}
Reduce the logging level
Writing to the console is very expensive. If you don’t need to have your logs set to trace or debug, then don’t.
One of the component that logs a lot is your ingress controller (Nginx, Traefik, Ambassador, etc.)
I ran a few small stress tests with 100 TPS against 2 Traefik pods, and every time I see the impact that logging to console has on performance, I am amazed:
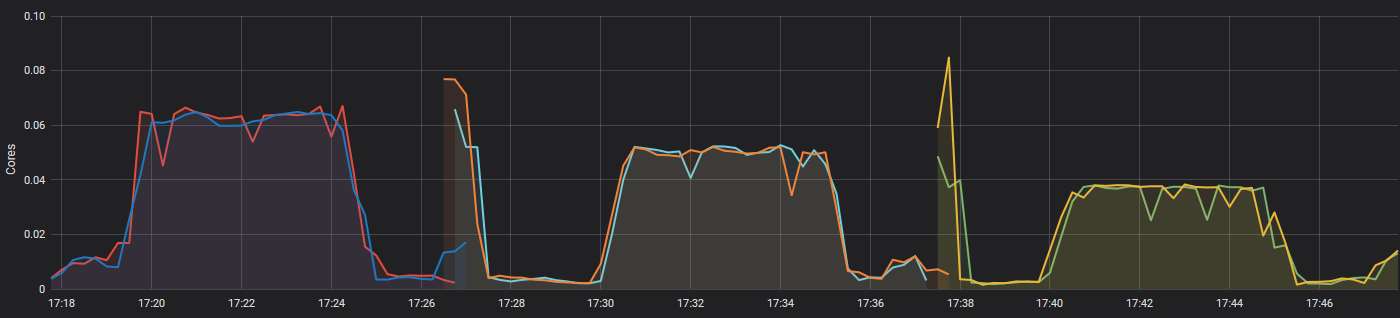
(NOTE: The brief spikes between each bumps correspond to the redeployment of Traefik after updating the parameters, please ignore them)
The first bump corresponds to Traefik deployed with access logs as well as a logging level of DEBUG. It averages to roughly 63m for each pods, for a total of 126m.
The second represents access logs, but with a logging level of WARN. This time, the average per pod is 50m, totaling 100m.
The last bump is for no access logs with a logging level of WARN. The average per pod went down to 37m, bringing the total to 74m.
As you can see, the logs accounted for nearly half of the total CPU usage.