Kubernetes - Efficient Autoscaling
Kubernetes is neat.
In terms of container orchestration, I’ve never had the opportunity to meddle with something as efficient, scalable, resilient and customizable as Kubernetes.
In this article, I’ll be talking about my experience with autoscaling applications on Kubernetes. In my case, most of these applications ran on the JVM (Java, Kotlin, etc), but this article applies to any applications.
Background story
At work, I was tasked with creating a continuous deployment application for Kubernetes. At the time, we were on Rancher, which unfortunately did not offer autoscaling capabilities, capabilities that, as the team I was part of was increasingly gaining traction, was becoming alarmingly important. Of course, we had some other concerns, but the main one was the lack of customizability.
I’ll spare the rest of the story, but all in all, that’s how I got into Kubernetes.
The challenges
As this article is specifically about autoscaling on Kubernetes, I won’t bother with the details of the implementation, as this was a project that spanned several months. Instead, I’ll focus on autoscaling and the factors that influence how you should scale each application.
Application with a long startup time
Applications that run on the JVM are terribly slow to start, even more so if you’re using a framework that does reflection, dependency injection, etc.
Once the application is started, then everything is good, but when it comes to autoscaling, startup time needs to be taken into consideration.
Reactive applications
Reactive programming is great and all, but it’s pretty troublesome to debug, and more importantly, requires special attention. Backpressure needs to be handled properly, and resources must also be allocated accordingly.
This article isn’t about reactive programming, but as reactive applications are more and more common, I think it’s worth at least mentioning why backpressure and resource management is important for this type of application.
Reactive programming is all about keeping a steady flow, and to do that, the pipe must never be clogged. While the bottleneck could be many things, we’ll just assume it’s CPU for this example.
Imagine a pipe.

This pipe has a different diameter based on the aforementioned bottlenecks (slow operations, blocking calls, CPU, etc)
What you’re aiming for is a pressure that’s high enough to make it clear when the application is processing data, therefore giving you a clear target for scaling.

If the pressure is too low, it will make it harder to the autoscaler to distinguish when the application is processing data and when it’s not. The most obvious solution might be to simply lower the average target of the metric used for scaling (e.g. target CPU utilization of 10%, which is very low), but you’ll end up with an application that scales up and down for no reason more often than not.

Having a low pressure, however, is not necessarily a bad thing. Sure, it’s wasteful, but on the grand scheme of things, it’s easily manageable, unlike the next case: too much pressure.

If your application cannot keep up with the amount of data it’s receiving, what would happen? According to the pretty drawing I made, it’d leak, but that’s just because I’m not very good at drawing and artistically expressing my thoughts.
All the new data the application is receiving needs to go somewhere. If you don’t have any rate limit set, then it goes straight to memory, until the pod runs out of memory and gets killed. If that application was a web server, then the new traffic gets redirected to the other replicas, which will also run in the same issue, until all of your replicas are down, and every time a replica is spun back up, it’ll instantly run out of memory.
Anyways, that’s the main danger of reactive applications for autoscaling. It doesn’t matter how good your autoscaling solution is, if your application cannot survive long enough for a new replica to spin up when there’s a lot of traffic, then it’s all for naught.
To reach your target pressure, you can either adjust the CPU/memory accordingly, set a rate limit or implement a solution that could handle backpressure for your specific use case, but you should definitely make sure to stress test it before going in production.
Resource management
This is one, if not the most important aspect of autoscaling, especially if you have applications that start slowly. This topic was partially covered in the previous section, so I might be repeating myself a few times.
You need to do stress tests on your stack and see how they handle load.
If you don’t properly configure the resources allocated for each pod, you might end up with a pretty domino effect.
Consider the following:
- Your application has a minimum of 4 replicas running and a maximum of 10.
- Each pod has a 2GB of memory allocated and 1 vCPU (1000m)
- Your HPA is configured to scale up at 50% CPU usage
Suddenly, there’s a peak in traffic.
Your 4 applications suddenly go from around 30% CPU utilization to 60%, thus triggering a scale up from 4 to 6 replicas. a few seconds later, the CPU utilization has reached 80%, but one of the replicas encounter an issue and it crashes. The load that this pod was handling is now split to the other 3 pods, causing them to run out of memory, killing them one by one.
Luckily, your two replicas finally managed to start up… only to instantly crash because they also ran out of memory.
Rate limiting is an easy way to fix this on the application level, but there are many other solutions which should be implemented to improve the resiliency of your important applications, but before jumping into a potential implementation (didn’t I say I wouldn’t talk about the implementation?), let me briefly introduce Quality of Service (QoS) .
There are 3 QoS classes: Guaranteed, Burstable and BestEffort.
Guaranteed is assigned when all containers in a pod have the same requested resources (cpu, mem) and resource limit. These pods will be the last ones to be evicted in case a node runs out of memory.
resources:
  requests:
    memory: 1024M
    cpu: 750m
  limits:
    memory: 1024M
    cpu: 750m
Keep in mind that the request you set will be set aside, whether the pod uses it or not.
If you set a request of 10GB and your pod uses 1GB, your pod is the only pod that can use this 10GB because it requested
that amount. If you make all your pods Guaranteed and the majority of your applications use a lot of memory, then be
ready for an expensive bill.
Burstable is assigned when at least one container has a request set. This allows containers to use as many resources as they wish, but keep in mind that only the resources you request are promised to be available to said container, and anything above risks causing your application to be throttled when it comes to CPU, or evicted when it comes to memory.
resources:
  requests:
    cpu: 300m
If you set a resource limit that is not equal to the requested resource, it will still be considered as burstable.
resources:
  requests:
    cpu: 300m
  limits:
    cpu: 500m
That being said, you should strive to set both requests and limits, as having no resource limits can
cause other pods to be evicted, leading to instability. One such example is setting a memory limit that is much higher
than the memory request, which, for certain garbage-collected languages, could cause the pod to end up being evicted
because it’s using more memory than it has requested and some other pod suddenly needs that memory.
resources:
  requests:
    memory: 512Mi
    cpu: 500m
  limits:
    memory: 2048Mi
    cpu: 1500m
BestEffort is assigned to pods whose containers do not have resource requests/limit set. These pods are free to use as much memory as they wish, but if the node they’re deployed in runs out of memory, they’re the first ones that will be evicted. Only low priority applications should use these.
Kubernetes automatically computes a score for each pods based on their classes.
I don’t want to get too deep into this, but basically, BestEffort have a high score, meaning that they’re the most likely to be evicted first while Guaranteed has the lowest score, meaning the opposite. Burstable’s OOM score is computed based on the resources requested (and the resource limits allocated, if any) as well as the node capacity.
The trick is that your very important applications should be Burstable with a request equivalent to what you’d put on the limit (or request, since they’re the same for Guaranteed QoS) of a Guaranteed pod.
resources:
  requests:
    memory: 4G
    cpu: 1500m
The high request will make OOM score give it a low score, thus making it unlikely to be randomly evicted. the lack of limit will prevent the pod from being OOMKilled, therefore giving enough time for the replicas to spin up without causing the pod to crash while it’s handling a higher load.
Isn’t that dangerous? Shouldn’t simply setting a higher limit be a better idea?
It is definitely dangerous, and that’s why I said very important applications.
If your application takes 30 seconds to be ready for traffic, then it means that if your traffic suddenly increases by 200%, your pods have to sustain that much extra traffic for 30 seconds. If we’re talking of going from 10 requests per second to 30 requests per seconds, that’s most likely not going to be a problem, but what if we’re talking about going from 1000 TPS to 3000 TPS? I’ve mentioned this earlier in the article, but here’s what would happen:
- Traffic increases by 200%
- HPA computes a new desired number of replicas from 5 to 20
- Clarification 1: We’ll assume that the HPA computes that instantly, but that wouldn’t be the case since the metrics are pulled at interval
- Clarification 2: Because the increase was sudden, the computed desired number of metrics will assume that the increase is linear and will keep increasing, which is why I didn’t say from 5 to 15.
- 15 new pods are being created (remember, we’re assuming it takes 30s for a pod of that application to be ready to receive traffic)
- One of the pod (we’ll call it
podA) has its memory above the limit, causing it to be evicted - The requests that were handled by
podAare now handled evenly bypodB,podC,podDandpodE podB,podC,podDandpodEare all OOMKilled one after the other due to the increased load- We’ll assume that the 30 seconds has elapsed, but this isn’t realistic as the sudden influx of traffic should have killed them in a matter of seconds, even more so if the limit set didn’t leave a bit of extra room for peaks like that.
- Every new pod that becomes ready, whether it be the 5 initial pods or the 15 other pods recently started, will become ready for traffic, and instantly get killed due to the amount of load.
In most contexts, not setting a limit is a risk, Kubernetes is not an exception.
So then isn’t it just generally better to set a limit, but set it very high?
It’s definitely a way to go about it, and it’s what I recommend for most use cases.
The strategy mentioned above assumes that what you configure as the request resource for your important application is a safe
amount. If you set your memory to 4GB, you assume that at most, your application will use 4GB RAM, and in case of unusual peaks,
it may go up to 5-6GB. In a way, it’s like a guaranteed pod, except it guarantees that your pods will stay up rather than
guaranteeing that you’ll have the resources that you need.
If it suddenly peaked to 12GB, that could cause some other pods to be evicted. I’ll reiterate one more time just to be clear, that’s exactly why I said only very important applications should have no limits: these applications should be so important that even if every other applications went down, as long as that application is up, you’re not putting your business in jeopardy.
The real purpose of this strategy is that even if some applications start using more memory and other pods get evicted, you can still serve content from these very important applications, and this gives enough time for more nodes to be scaled up, in which these previously evicted pods will be able to settle into.
You have to make some sacrifices and you have to be able to say what takes precedence over what. If you have the budget to allocate too much resources and you don’t mind being wasteful, then go ahead, give too much resources to your pods, spawn too much nodes than what you need. The truth is, for most of us, that’s not a luxury we can afford. Scalability is, in a way, about minimizing the cost.
Without autoscaling, you need to have enough servers to handle your peaks in traffic. With autoscaling, however, you can have less servers (nodes) at your disposal while being able to do more.
Consider the following:
appA and appB both require 10 instances to support their peak traffic.
Without autoscaling, you need 20 instances at all time to be up.
With autoscaling (take this with a grain of salt, it depends on the applications too)
- When appA has peak traffic and appB barely has any traffic, you need 11 instances in total.
- When appA and appB both have a moderate amount of traffic, you need 10 instances in total.
- When appA and appB both have peak traffic, you need 20 instances in total.
- When appA and appB both have very little traffic, you need 2 instances in total (may differ depending on your configured minimum desired replicas, but let’s assume the minimum is 1 for maximum cost reduction)
It’s true that you’ll run into some issues; being unable to scale up fast enough from times to times, but the difference is that with autoscaling:
- When appA and appB are getting even more traffic than usual peak traffic, you’ll be able to scale up to meet their demand.
- When appA and appB are both getting DDoS’d, your service will still be up and running, though your bill will also scale accordingly.
- In the long run, you’ll save a lot more money.
Glorify scalability however you want, but at the end, scalability is the art of finding the balance between cost and availability. More demand? More cost. Less demand? Less cost. If your architecture adapt to both points above automatically, then it scales.
So to go back to the subject, if you have important applications, but not important enough to be worth half of the pods in the cluster being evicted, then you can do the same as I mentioned for your very important applications, but with a limit that’s higher, e.g.:
resources:
  requests:
    memory: 4G
    cpu: 1500m
  limits:
    memory: 6G
    cpu: 1500m
This will allow enough time for scaling up, without having to endanger other pods on the cluster.
I highly suggest reading Kubernetes’ documentation on Node OOM Behavior
Rate limiting
Scalability is nice, but sooner or later, you’ll hit a bottleneck, even if that bottleneck is budget.
You tested application B, and you know it starts to get really slow after 100 transactions per second (TPS).
Rather than just hoping that it never gets to that point, ensure that this will never happen by setting a rate limit, or at least set a timeout.
I’m sure if you’re reading this, you must have some common sense. It’s better to reject some requests than to cause all calls to slow down considerably, therefore, it’s good practice to implement rate limiting.
Per-application configuration
If you think that there’s one format to fit all, you’re wrong, unless all your applications do the exact same thing. Each applications behave differently, ergo needs to be scaled differently.
This is time consuming, but the aggregation of each customized autoscaling configuration is what will make your stack resilient and truly scalable.
Bad metrics, Good metrics
To be fair, there are no bad metrics, but it’s very easy to use the wrong metrics for the wrong situations.
Requests per second (RPS)
While this is not offered out of the box, thanks to Kubernetes’ highly customizable environment, you can easily create your own metrics that the horizontal pod autoscaler (HPA) can use.
… Or you could just use an already well known, established solution: Prometheus.
That being said, scaling by requests per second is generally a bad idea, unless you have a very stable number of requests per second. Let me explain: not all requests are equal. Some requests require more processing than others, meaning that scaling by requests per second might not be accurate if, say, you get a peak in requests that require more processing than others.
Scaling by number of messages (SQS, Kafka)
If one of your applications is pulling messages from a queue, it might sound intuitive to scale based on the number of messages available in the queue. More messages in the queue means more message to process, so it’s the perfect metric, right?
It depends. If you’re not handling backpressure properly, then sure, you can scale based on the number of messages available.
There’s nothing wrong with that, if you’re pressed for time, you can scale based on the number of messages in the queue, but if you have to resort to that rather than scaling based on memory utilization or cpu utilization, then it means that you’re either giving too much CPU (or memory) to the application for no reason, or you’re rate limiting too much.
If you give 1000m cpu to your application, but when it’s pulling messages, it’s only reaching 150m-ish,
then your application could be working harder.
Another reason why you’d want to scale by number of messages in a queue is because the messages are highly variable, meaning that some are extremely large (hard to process), some are extremely small (easy to process), so to compensate, you rate limit it to prevent the containers from running out of memory when your application suddenly receive multiple large messages in a row.
Memory
Offered straight out of the box, this is one of the two default metrics for autoscaling.
Scaling based on memory utilization is a good idea when your application is processing large chunks of data: files, images, etc.
Reactive applications, however, are a different story. From what I’ve seen, when a reactive application is unable to process data quickly enough (e.g. not enough CPU or slow dependencies), it causes the memory usage to spike. In that case, the solution is often not to scale based on memory utilization, but rather, increase the amount of CPU (or handle backpressure accordingly) and scale based on CPU utilization. In fact, when the memory starts increasing, it’s probably too late to scale up, as before your other replica has enough time to start up, it’ll already have run out of memory, possibly getting OOMKilled in the process. Of course, there are other solutions to this, such as setting higher memory/cpu limits, but that’s not necessarily the best solution.
Kubernetes is great because it gives you dozens of ways to do the same thing, but this also opens the door for developing unhealthy habits (e.g. increasing memory every time an application runs out of memory rather than investigating why it ran out of memory).
CPU
Available out of the box, CPU is one of the most reliable metrics for scaling, provided you use it properly.
Like I mentioned previously, there’s no one-key-fits-all-doors solution, you’ll have to test your application and monitor its resource usage. That being said, scaling based on CPU utilization is generally great for applications that process a lot of small things quickly.
Just like with memory, this metric is often misconfigured.
The value you set for targetCPUUtilizationPercentage is not when you want to scale up, it’s
what you want your replicas to hover around.
If you have a minimum of 2 replicas for an application, and that application has a target utilization of 70%, then what if one of the replicas suddenly crash while they were both at around ~65%? You’re stuck with one replica to handle the equivalent of 130%. And what if that one replica you have left suddenly runs out of memory before the other replica had enough time to start up? Both replicas are down, and whenever one of the application will have started back up, it’ll crash again, potentially killing your whole stack.
If your application has a slow startup time, it’s important that you have a low utilization target to make up for that slow startup speed.
You’ll notice that most images made for Kubernetes are in Go, and that’s because Go starts very fast, therefore it’s understandable if it has a target of 70-80% – it’ll take a few milliseconds to spin up another replica.
But a Java application that uses Spring Boot and takes 15-20 seconds to start? 30% is a much more reasonable target.
Autoscaling is all about predicting ahead of time.
The best of both worlds
Microservices. If your services have too many responsibilities, these responsibilities won’t be able to scale independently.
Microservices done properly are the most cost-effective and scalable applications.
If you have fewer, but bigger applications, these tend to take longer to start up, which makes scaling up slower.
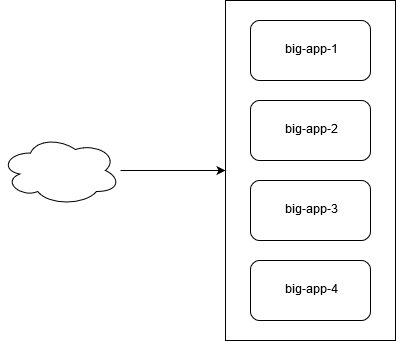
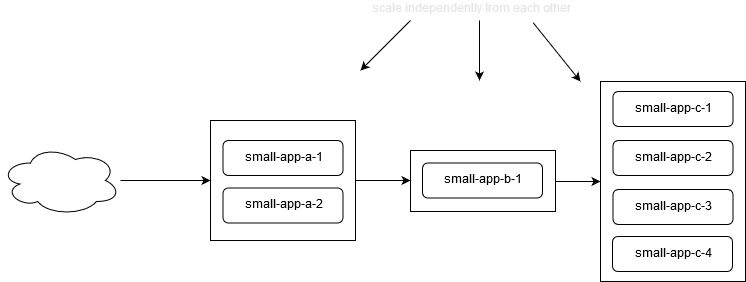
If you have more, but smaller applications, these tend to start faster, which makes scaling up faster. Not just that, but unlike with bigger applications, the several smaller applications can scale independently, therefore reducing the overall cost. With Kubernetes, this is even better, because the applications do not communicate over the public Internet, meaning no additional data transfer cost are billed.
Applications that start fast scale better. Go is a relatively new programming language, and it already powers a massive part of the cloud (Docker, Kubernetes), and why shouldn’t it? It’s fast, has a small memory footprint and starts extremely quickly.